Endpoints Monitoring - BlackBox Exporter
Endpoints monitoring is an important part of the infrastructure observability for discovering availability and performance problems. In this small post, I’ll go through the general steps to setup Blackbox exporter leveraging the kube-prometheus-stack.
kube-prometheus-stack is a collection of manifests and components, including Grafana dashboards and Prometheus rules targeting the monitoring of a Kubernetes cluster. In general, the Prometheus monitoring stack consists of several scrappable endpoints that collect metrics called exporters, Prometheus itself to collect and store those metrics, and Grafana, which provides visualization of the data stored leveraging the PromQL query language:
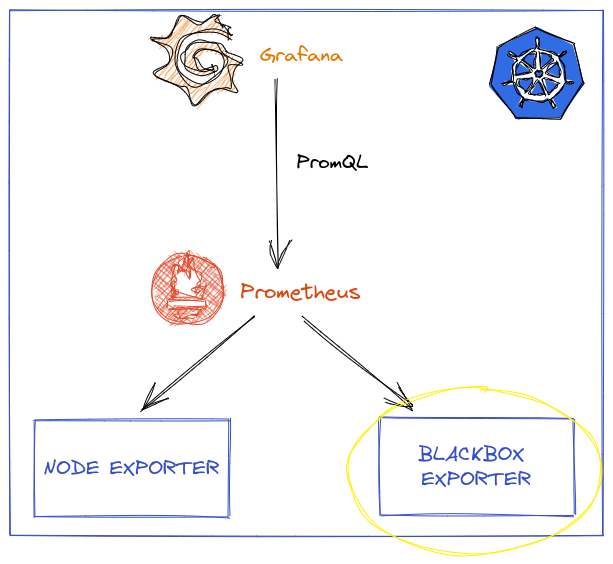
Diagram made with one of my favourite tools, Excalidraw
In order to collect different system metrics, the figure of exporters is one of the most important parts of Prometheus monitoring stack. There are many exporters out there and, in case you can’t find one for the purpose you are seeking, you are very welcomed to develop your own metric exporter (there are a number of libraries for different programming languages that ease this task).
Now, let’s get down to business!
First, we will install the blackbox exporter leveraging Helm. Remember you can customize the Blackbox exporter configuration by providing your own values.yaml file based on the supported values. I’ll install it in the monitoring namespace of my cluster, hence -n monitoring parameter passed to Helm:
helm repo add prometheus-community https://prometheus-community.github.io/helm-charts
helm repo update
helm install blackbox-exporter prometheus-community/prometheus-blackbox-exporter -n monitoring
Please note that Helm release name matters in terms of DNS names and we will need that to refer the Blackbox exporter in the next step!
Once Blackbox Helm chart is installed, we go on to install Prometheus stack Helm chart, but adding some additional scrapping configuration in its own values.yaml file:
prometheus:
  prometheusSpec:
    additionalScrapeConfigs:
      - job_name: blackbox
        metrics_path: /probe
        params:
          module: [http_2xx]
        static_configs:
          # Blackbox targets to scrape
          - targets:
            - https://www.google.com
            - https://ruben-rodriguez.github.io
        relabel_configs:
        - source_labels: [__address__]
          target_label: __param_target
        - source_labels: [__param_target]
          target_label: target
        - target_label: __address__
          # This is what makes blackbox exporter reachable from Prometheus
          replacement: blackbox-exporter-prometheus-blackbox-exporter:9115
And install with Helm (if you executed previous helm repo commands, you can skip these ones):
helm repo add prometheus-community https://prometheus-community.github.io/helm-charts
helm repo update
helm install prometheus prometheus-community/kube-prometheus-stack -n monitoring --values values.yaml
After Prometheus is installed, it should be scrapping the Blackbox exporter, you can check by port-forwarding the Prometheus service in the Cluster to a port in your machine with kubectl:
kubectl port-forward svc/prometheus-kube-prometheus-prometheus 3000:9090
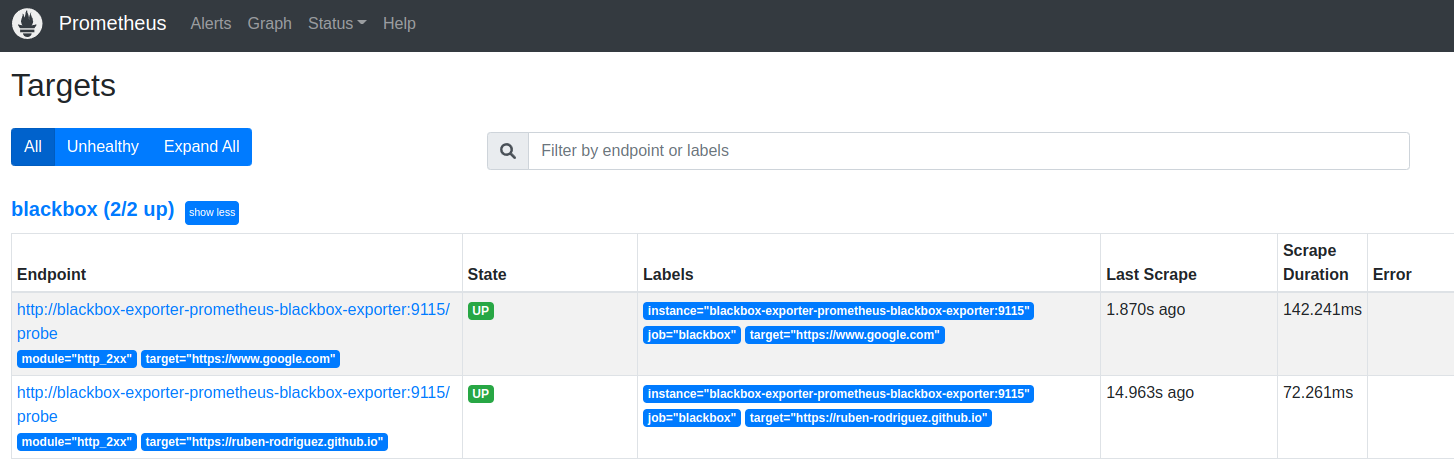
Once you access http://localhost:3000/, in the Targets section of Prometheus, we should see the Blackbox exporter endpoints:
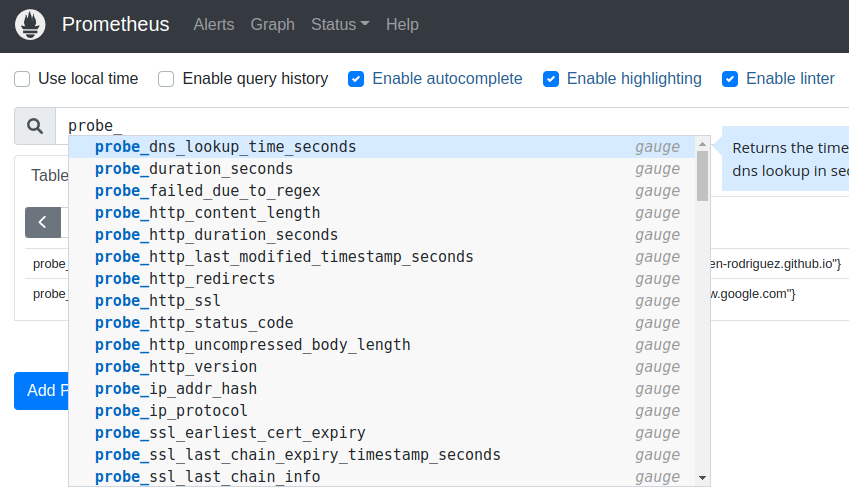
Furthermore, the metrics available for these endpoints can now be queried:
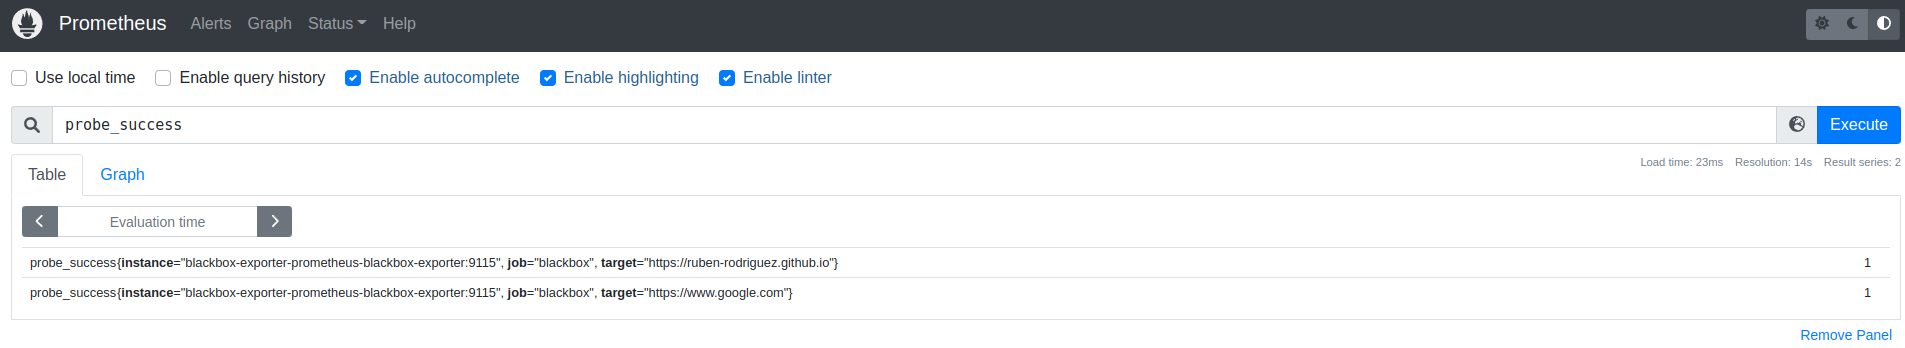
And that’s it, now you can start querying these metrics from Grafana and craft some awesome dashboards, or you can try one of the availables in Grafana Dashboards page